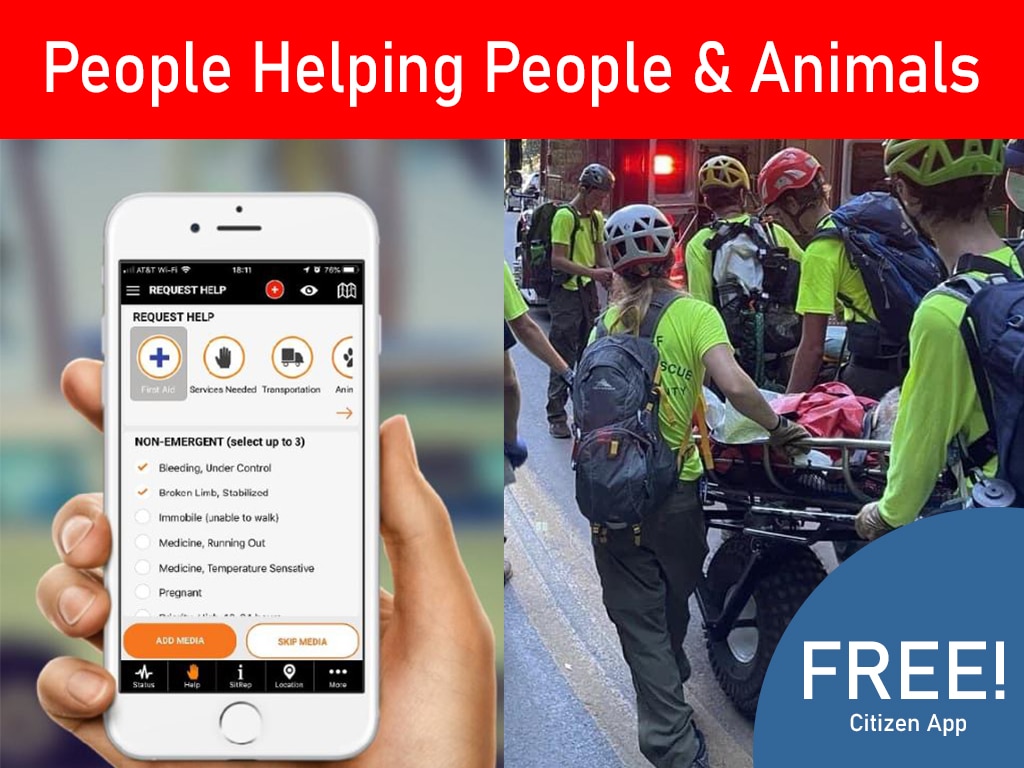
Emergency response KPIs help local governments and NGOs answer a harder question than “How busy were we?” They show whether alerts reached the right people, volunteers were deployed safely, incidents moved toward resolution, resources were fulfilled, and reports arrived in time to guide the next decision. A useful dashboard connects those measures to action instead of turning response activity into a collection of impressive but disconnected counts.
What should an emergency response KPI dashboard measure?
For a municipality, the dashboard may support an emergency manager, an EOC, department leaders, and elected officials. For an NGO, it may help an operations director coordinate volunteers, partner organizations, and distribution teams. The audiences differ, but the measurement logic is similar: define the decision, identify the signal that informs it, and document the limits of the data.
FEMA’s National Preparedness System describes performance measurement as a way to track capability progress, identify gaps, and support resource allocation. That principle is useful at the local level: a KPI is valuable when it changes what a leader does next, not merely when it can be displayed on a screen.
Read FEMA’s National Preparedness System overview for the broader capability-measurement context.
1. Alert reach and acknowledgement
Alert activity is not the same as alert effectiveness. A system may send thousands of notifications while leaders still do not know whether the intended audience received, understood, and acted on the message.
- Reach rate: delivered alerts divided by the intended recipient list, reported by channel and audience.
- Acknowledgement rate: recipients who confirm receipt divided by delivered alerts.
- Time to acknowledgement: median and 90th-percentile time between delivery and confirmation.
- Escalation rate: the share of alerts requiring a second channel or manual follow-up.
Break these measures down by geography, organization, role, and channel. An overall 90% acknowledgement rate can hide a neighborhood, volunteer group, or partner agency that is consistently missed. Also record the denominator and the timestamp used. Without those details, a percentage can look precise while describing a changing population.
2. Volunteer deployment and readiness
Volunteer counts are useful only when they are connected to readiness and assignment quality. Track whether people who were contacted were qualified, available, assigned to a defined task, and able to report their status.
- Activation rate: volunteers who accept an assignment divided by volunteers asked.
- Time to fill a mission: elapsed time from a deployment request to a confirmed team.
- Deployment completion rate: assignments completed with a status update divided by assignments accepted.
- Credential or training coverage: active volunteers with the required qualifications divided by the roster for that role.
- Unassigned demand: open assignments past their target time.
Do not treat a large roster as proof of response capacity. A smaller, current roster with verified availability may be more useful than a larger list that has not been updated. Compare deployment results with the mission type, distance, time of day, and required skills. The purpose is to identify bottlenecks, not to rank volunteers publicly.
3. How do you measure incident resolution without gaming the numbers?
Incident volume and closure counts are activity measures. They do not prove that conditions improved. A more useful incident scorecard follows the record from intake to a documented outcome.
- Time to triage: median time from report submission to severity or priority classification.
- Time to first action: time from triage to the first documented response.
- Resolution time: elapsed time from accepted incident to a defined closure condition.
- Reopen rate: incidents reopened after closure divided by closed incidents.
- Outcome documentation rate: closed incidents with a clear result, responsible unit, and timestamp.
Define resolution before measuring it. For a welfare check, resolution may mean a verified contact or handoff. For a damage report, it may mean inspection, referral, or repair confirmation. One universal closure rule will distort results across incident types. Segment by category and severity, and report medians alongside outliers so a few complex cases are not hidden by an average.
4. Resource requests and fulfillment
Emergency resource requests give leaders a direct view of unmet demand. Track the path from request to acknowledgement, approval, assignment, delivery, and confirmation. The aim is to show where a request is waiting and whether the person or organization who asked can see its status.
- Request acknowledgement time: time from submission to confirmation that the request entered the workflow.
- Fulfillment rate: requests completed within the target window divided by eligible requests.
- Time to fulfillment: median time from approved request to delivery or handoff.
- Backlog age: age of the oldest open request, shown by priority.
- Partial fulfillment rate: requests completed in part but still carrying an unmet need.
Do not count a request as fulfilled simply because it was assigned. Use a recipient confirmation, delivery record, or other agreed evidence. Report canceled and duplicate requests separately so they do not distort the operational backlog.
5. Reporting timeliness and data quality
Timely reporting is a response capability in its own right. If field updates arrive after a shift, meeting, or operational decision, a complete report may still be too late to help.
- On-time reporting rate: reports received by the agreed deadline divided by reports expected.
- Update freshness: time since the last valid status update for an open incident, team, or request.
- Data completeness: records containing required fields such as location, category, owner, status, and timestamp.
- Duplicate rate: records identified as duplicates divided by total submitted records.
- Correction rate: records needing material correction after review.
Set different deadlines for different operational contexts. A field team may need a rapid status update during an active deployment, while a grant or after-action report may follow a longer review cycle. Keep the original submission time and the latest edit time so a late correction does not appear to be an on-time report.

How can a local government or NGO build a practical KPI dashboard?
Start with a small decision-oriented scorecard rather than a wall of metrics. A first version can use one or two measures in each category and expand only when leaders can explain how they use the result.
| Dashboard area | Starter KPI | Review question |
|---|---|---|
| Communication | Reach and median acknowledgement time | Who has not confirmed receipt? |
| People | Time to fill a deployment | Which role or area has an availability gap? |
| Incidents | Time to triage and reopen rate | Are closures producing durable outcomes? |
| Resources | Open backlog by age and priority | Which request needs an owner or escalation? |
| Reporting | Update freshness and completeness | Can the current data support today’s decision? |
Assign each KPI a definition, formula, data owner, target or baseline, review cadence, and escalation rule. A daily operational view may emphasize open demand and freshness. A weekly leadership view may emphasize trends, capacity gaps, and repeated failure points. A post-incident review can examine whether the chosen measures predicted or explained the outcome.
What should leaders avoid when choosing emergency response KPIs?
Three measurement mistakes appear across public agencies and nonprofits:
- Confusing volume with value. More alerts, reports, or volunteers contacted may reflect a larger incident, not better performance.
- Hiding the denominator. Percentages without audience size, eligible requests, or expected reports cannot be compared responsibly.
- Rewarding speed without quality. Fast closure can encourage premature status changes. Pair speed with reopen rate, completeness, or a verified outcome.
Review the dashboard with the people who create the data. If a measure is expensive to collect, easy to misunderstand, or disconnected from a decision, retire it or redesign it. A small scorecard that teams trust will outperform a larger dashboard that nobody maintains.
Emergency response KPI dashboard FAQs
What are the most important emergency response KPIs?
Start with alert reach and acknowledgement, volunteer deployment time, incident triage and resolution, resource-request fulfillment, and reporting timeliness. Select the measures that match the decisions your team must make during an incident.
How many KPIs should an emergency response dashboard include?
There is no universal number, but a focused first dashboard can use one or two measures across communication, people, incidents, resources, and reporting. Add metrics only when they have a clear owner, definition, and operational use.
What is the difference between an activity metric and an outcome metric?
An activity metric counts what a team did, such as alerts sent or requests assigned. An outcome metric shows what changed, such as acknowledgement, verified fulfillment, or a durable incident resolution. Strong dashboards use both and do not treat activity as proof of success.
PubSafe supports real-time incident reporting, organization and volunteer coordination, and emergency communication workflows that can provide operational data for this kind of review. Learn how PubSafe supports disaster response coordination.